
This instruction briefly describes how to use the indicator. If you want to understand in more detail, solve tests and homework, you can take a training course. To do this, it is enough to sign up for the first month of subscription.
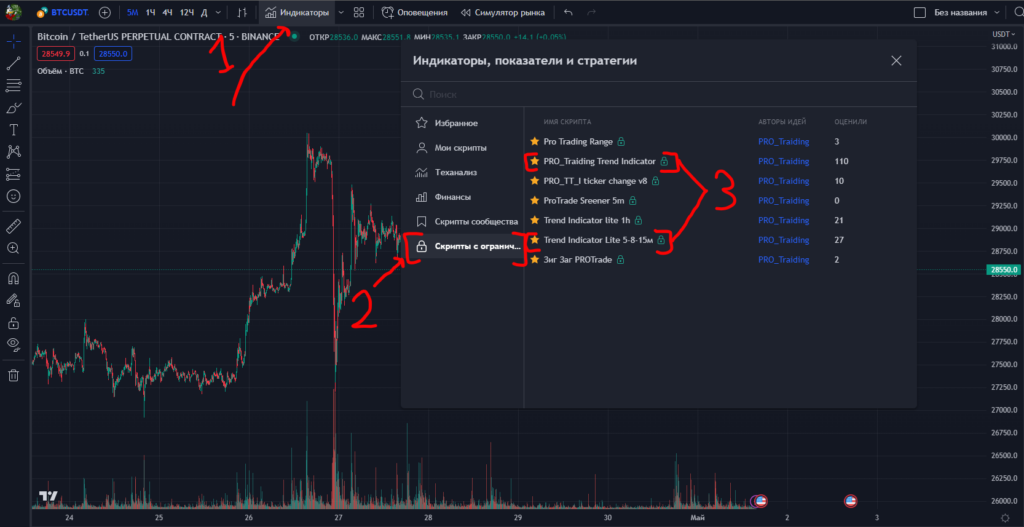
How to add an indicator
If you have submitted an application, this implies that you have registered for a trading review.
It is necessary to open the working panel of the chart on the trading view platform, open the indicators menu in the top tab, then the indicators tab with limited access, and add two main indicators — PRO_TRAIDING TREND INDICATOR and TREND INDICATOR LITE.
Trading Strategy
You can use indicators as it is convenient for you (to combine with your own experience), or as we use it.
In our strategy, we use both indicators. The concept is as follows:
- determine the direction of entry into the transaction;
- determine the entry point to the transaction;
- determine exit points and stop loss.
The direction of entry into the transaction
In our case, we recommend using two options for determining the entry into the transaction: for a timeframe less than 1h, and for a timeframe greater than 1h.
If the timeframe is 1h or more
To determine the entry directions, we use the TREND INDICATOR LITE indicator in automatic mode.
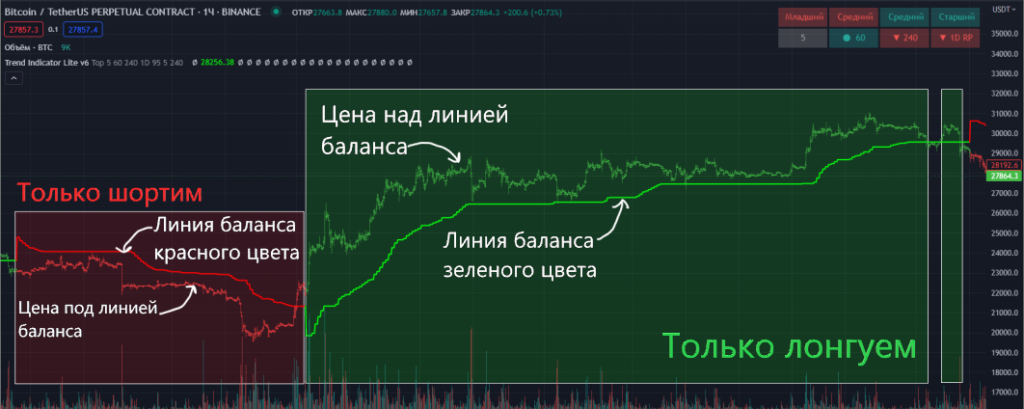
The priority of transactions is long (purchase) — this means that we only make a purchase. To do this, two conditions must be met:
- The balance line is green;
- — The price bars are above the balance line.
The priority of short transactions (sale) — this means that we only make a sale. To do this, two conditions must be met:
- The balance line is red;
- — Price bars are located under the balance line.
If the timeframe is less than 1h
To determine the entry directions, we use the TREND INDICATOR LITE indicator in automatic mode. As well as the PRO_TRAINING TREND INDICATOR in automatic mode.
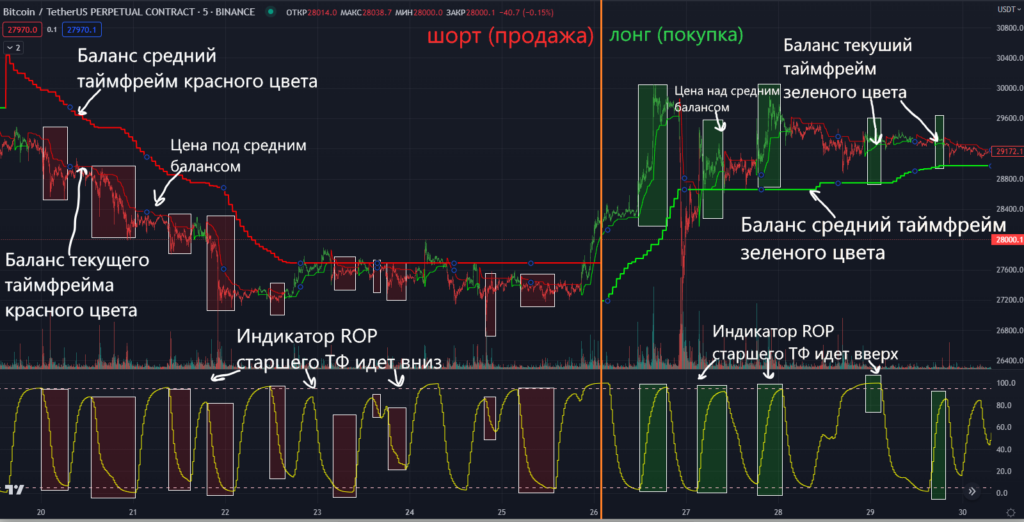
The priority of transactions is long (purchase) — this means that we only make a purchase. To do this, four conditions must be met:
- The average balance line is green;
- The current balance line is green;
- — Price bars are above the average balance line;
- The ROP line of the senior TF goes in the upward direction.
The priority of short transactions (sale) — this means that we only make a sale. To do this, four conditions must be met:
- The average balance line is red;
- The current balance line is red;
- — Price bars are below the average balance line;
- The ROP line of the senior TF goes in a downward direction.
Entry and exit points to the deal
To determine the entry points, we use the PRO_TRADING TREND INDICATOR in automatic mode
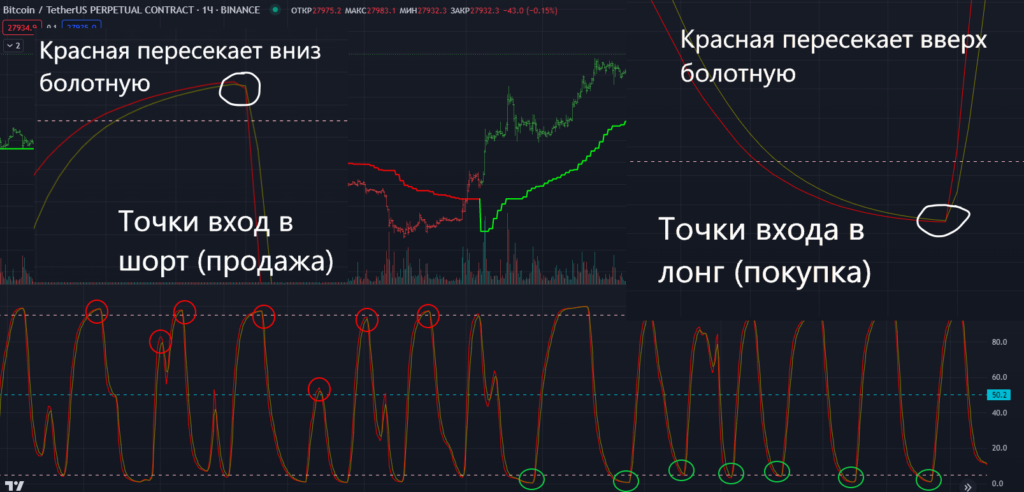
The main conditions for entering into a deal in long (purchase):
- The direction of entry into the transaction is long;
- The red ROP line crosses the bolotnaya from the bottom up;
- The red ROP line is not higher than the 50 mark.
The main conditions for entering into a short (sale) transaction:
- The direction of entry into the transaction is short;
- The red ROP line crosses the Bolotnaya from top to bottom;
- The red ROP line is not lower than the 50 mark.
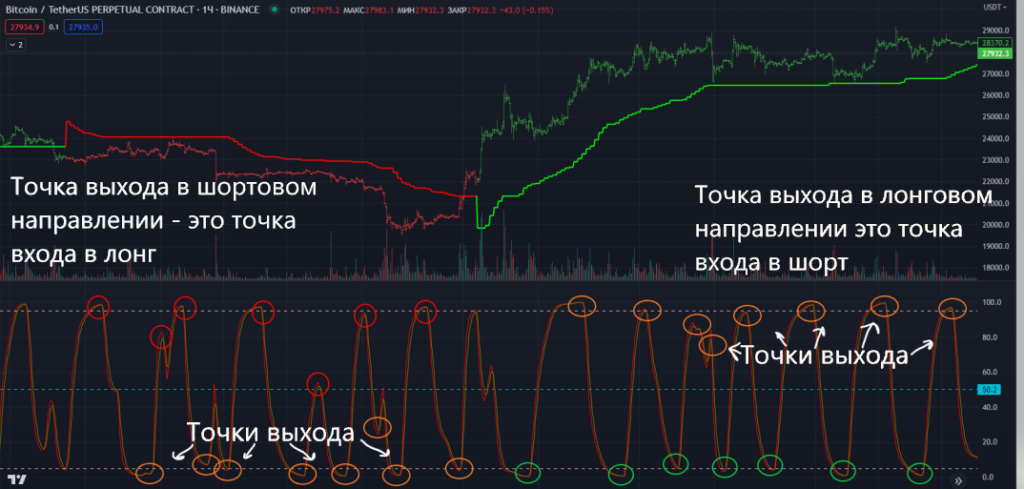
If the direction of entry into the trade is long, then the exit point from the long trade will be the entry point into the short, that is, when the red crosses the swamp from top to bottom above 50.
If the direction of entry into the transaction is short, then the exit point from the short transaction will be the point of entry into the long, that is, when the red crosses the bolotnaya from the bottom up above 50.
STOP LOSS / TAKE PROFIT
To make stop loss and take profit levels, we use the TREND INDICATOR LITE indicator in automatic mode.
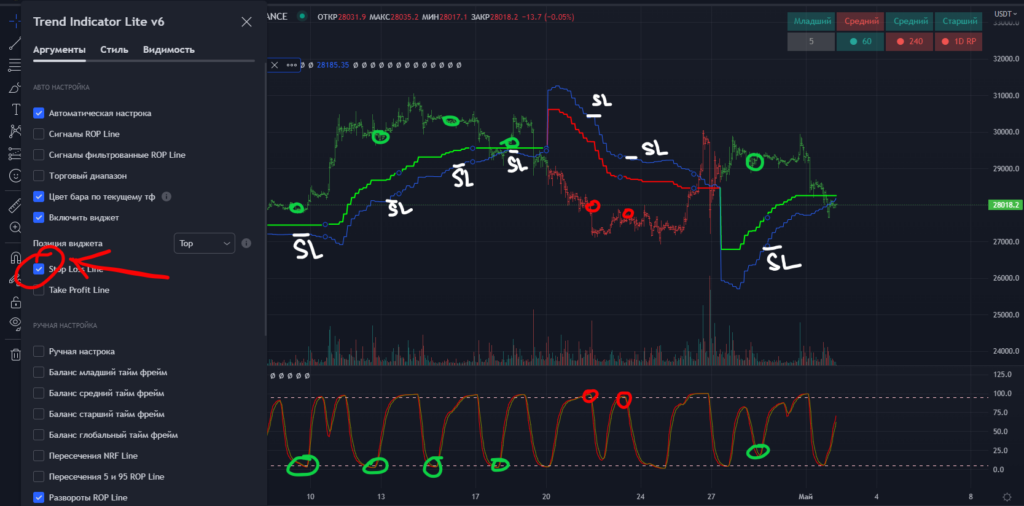
We look at which bar there was an entry signal, and from it we look at what level the stop loss line is. At this level, we place a stop loss order.
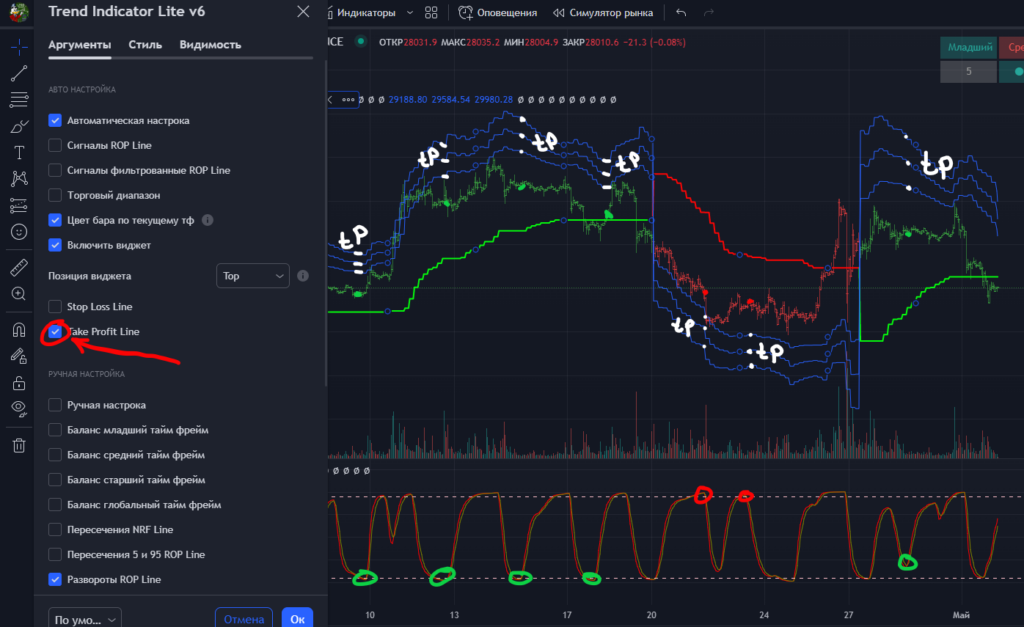
We look at which bar there was an entry signal, and from it we look at what level of the take profit line. At this level, we set take profit orders.
If the take is not taken and an exit signal is received, then it is necessary to exit the position.
P.S.
Basic settings in automatic mode are enough for successful trading.
However, in addition to automatic settings, the indicator has a manual mode where you can adjust the parameters for a specific trading pair.
There are also additional filtering options, useful widgets, alerts and other features. They are described in the training course.