List of basic indicators
This is the main indicator that includes six main tools for successful trading. Each tool is used in its own way, sharing allows you to build a common chain forming a trading strategy.
What PRO_Traiding Trend Indicator consists of
Pro Traiding Trend Indicator consists of six main instruments.
Trend Line (orange) — The slowest indicates the dominant trend.
ROP RSI LINE (red) — the rate of price change, the second line by speed, shows the trend within the trend.
ROP RSI LINE 2tf (yellow) is the same as ROP RSI, just a different timeframe.
RSI LINE (purple) — what is the position of the price at the moment.
FILTER LINE 5-8-15 (blue) — shows the best zones for a set of positions.
NEW FILTER ROP (green and orange) — works like ROP RSI LINE, gives signals earlier.
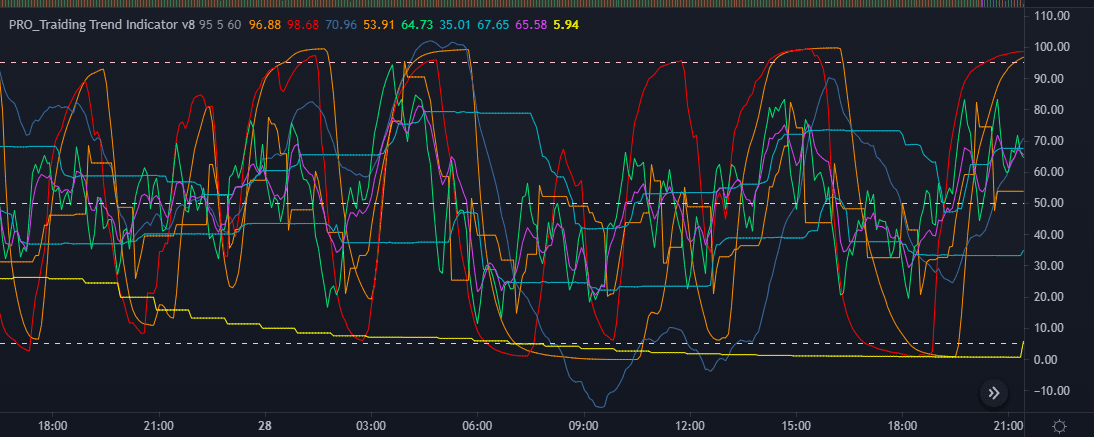
Pro traiding trend indicator
Trend line (orange line)
Trend Line, or just a trend line, is an oscillator. The slowest line of the indicator shows a long-term trend, but has a delay.
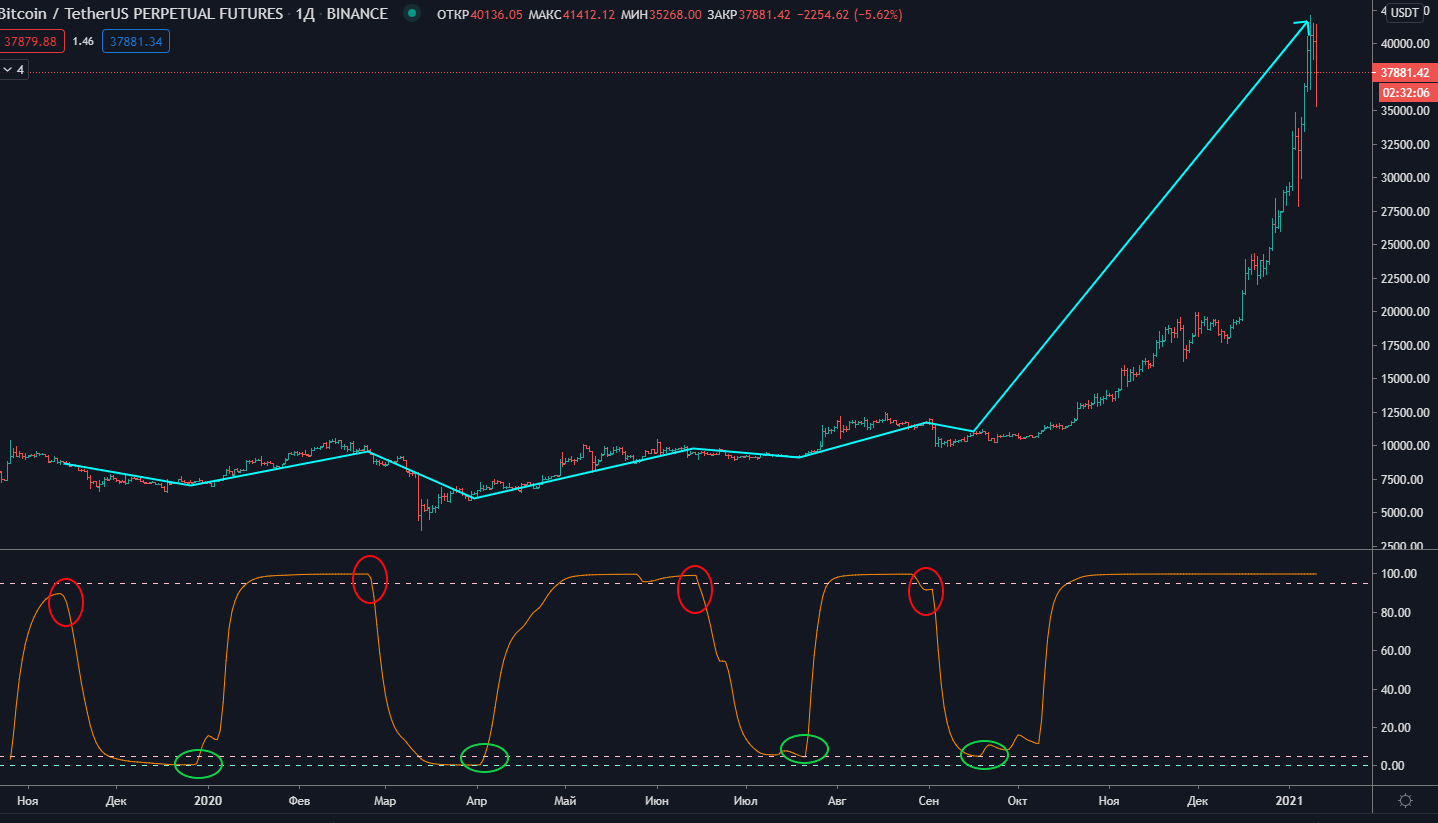
Trend line
Tren Line shows the long-term dynamics of the price direction development. Important signals are a line break.
A signal to a long is formed as a result of crossing the Trend Line indicator line of level 5 from bottom to top.
A signal to a short occurs as a result of the crossing of the Trend Line level 95 from top to bottom.
These signals are good, but you should enter them correctly after waiting for confirmation. However, they can have a significant delay.
ROP RSI Line (red line)
The Rop RSI Line indicator line is the line for entering a trade. This indicator line is faster than the Trend Line and shows the trend within the trend.
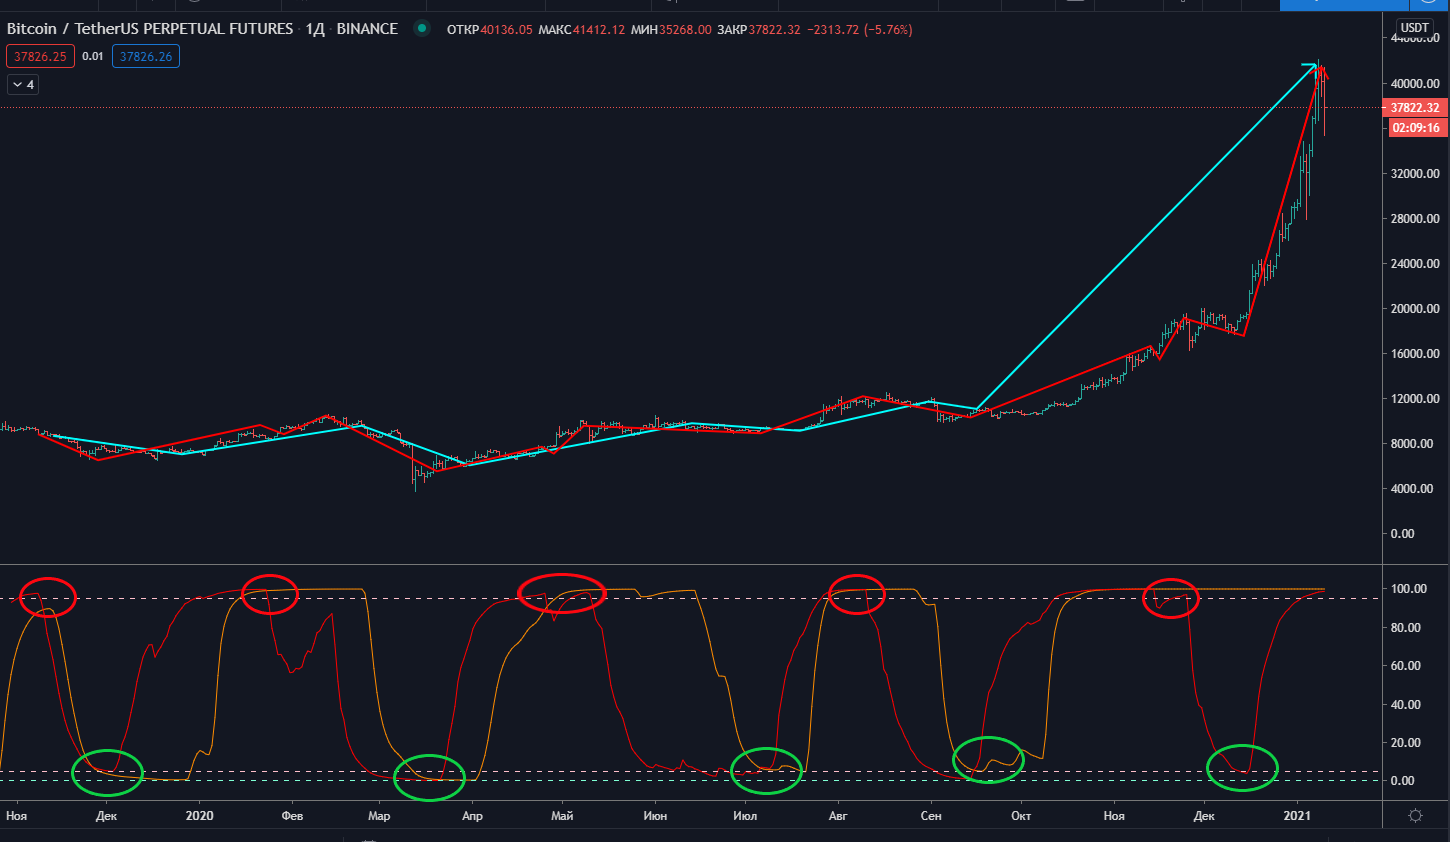
ROP RSI Line
The ROP RSI LINE trend indicator is also a trend line, but shows a trend within a trend. Indicates a reversal much earlier, allowing the trader to prepare and find the best entry point. You need to understand that the Trend Line has priority, that is, for example, if on an upward market along the Trend Line, a signal comes to short from the ROP RSI, in this case the signal may be weak and be a pause, that is, an accumulation (balance), and vice versa.
ROP RSI Line 2tf (yellow line)
The line of the Rop RSI Line 2f indicator is a line for filtering trade entry. This is the ROP RSI line of the higher time frame.
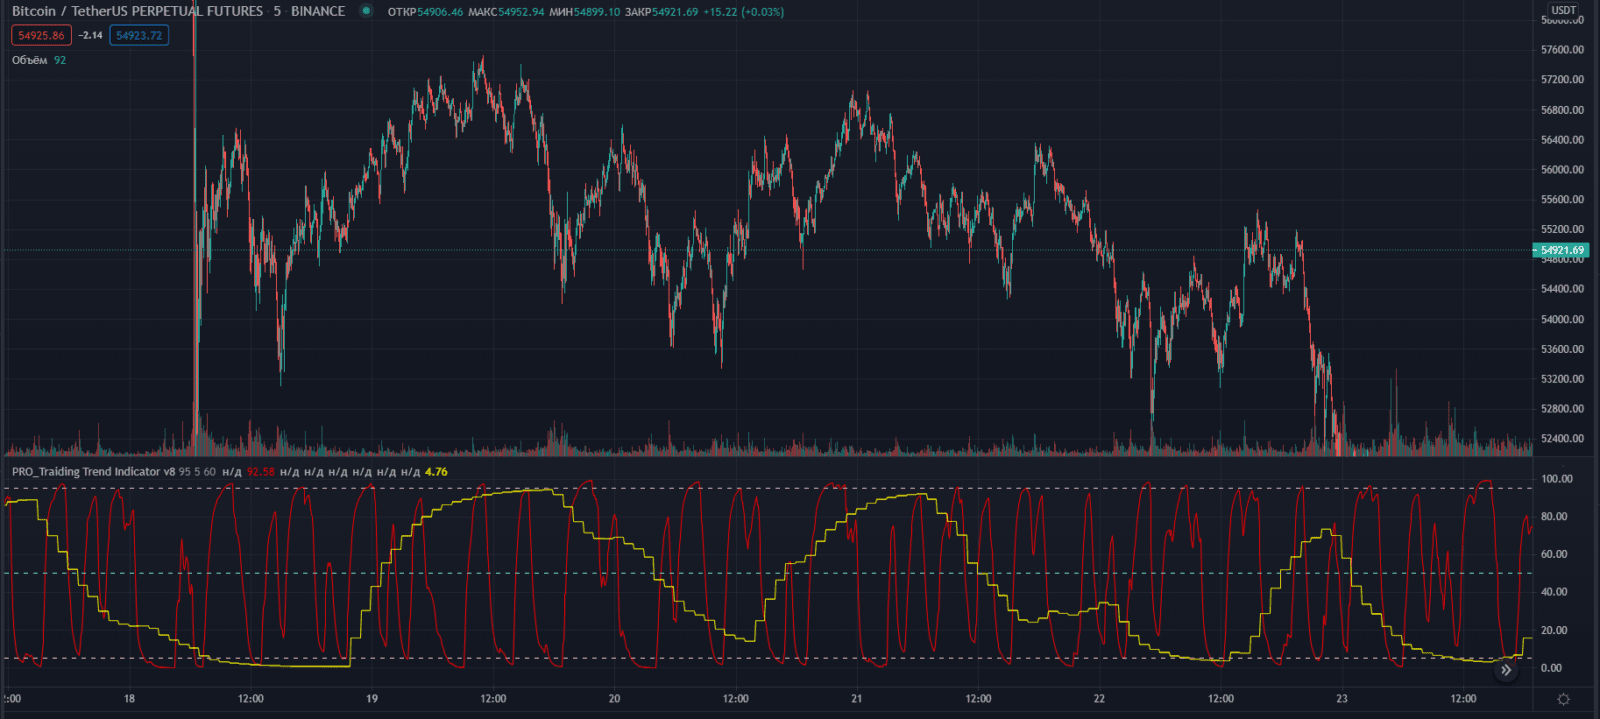
ROP RSI Line
ROP RSI LINE 2tf is a ROP RSI line with the ability to change the display of the time frame. That is, being on a 5m time frame, you can additionally enable, for example, a 1 hour time frame. In general, you can include any time frame. This gives the trader an understanding of what is happening in the market globally, because it is not profitable to trade against higher timeframes.
RSI Line (purple line)
The RSI line of the Pro traiding trend indicator is an auxiliary line. The main task is to compare the available signals with the ROP RSI and understand whether we are entering a trade correctly. It can also be used to find divergences.
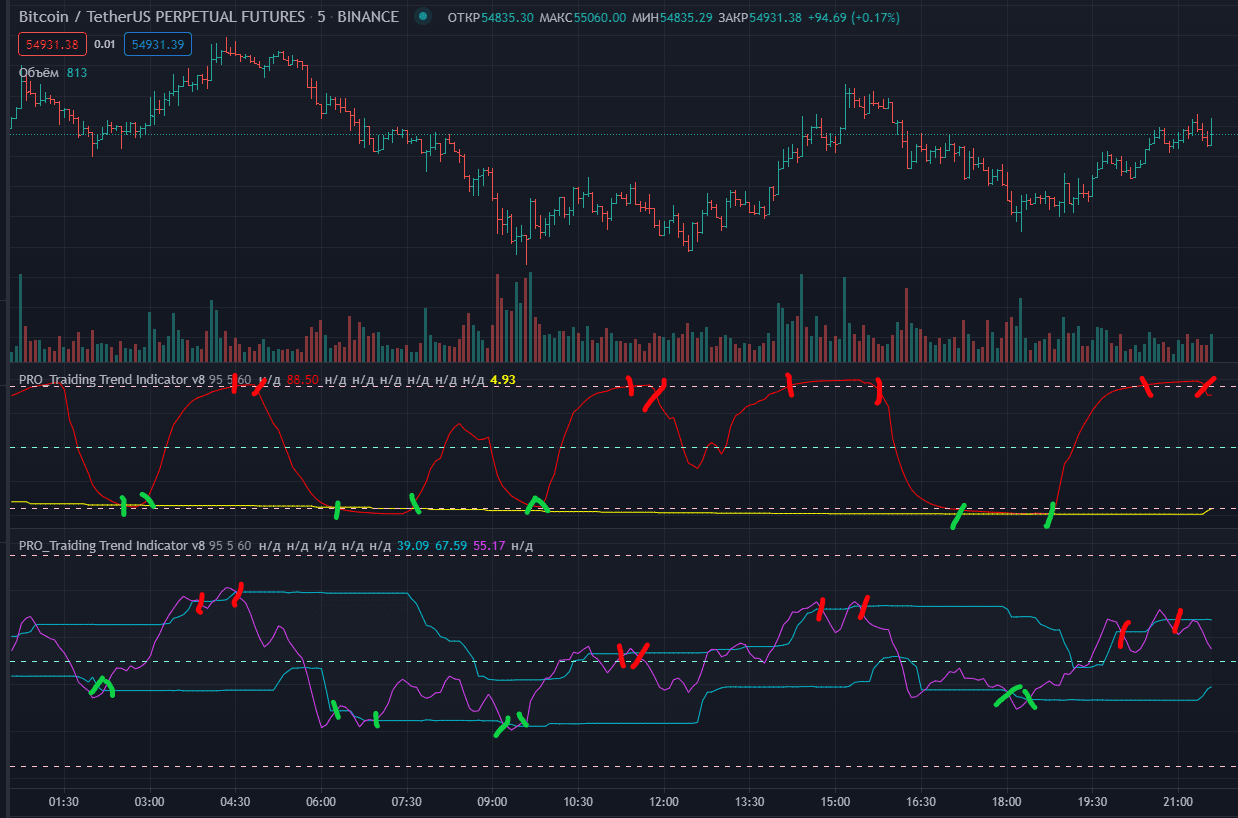
RSI Line
This RSI indicator has dynamic upper and lower bounds. When the RSI indicator (purple line) crosses the borders inward, buy or sell signals are received.
If the purple line crosses the upper line down, this is a sell signal.
If the purple line crosses the lower line upwards, this is a buy signal.
When used together, when the RSI indicator is in oversold or overbought zones (above 95 or below 5), signals to cross the upper or lower RSI purple line warn of a possible trend change.
FILTER LINE 5-8-15 (blue)
Filter Line is an oscillator applied on a 5-15 minute timeframe. It works on the principle of an oscillator, that is, it shows overbought and oversold zones.
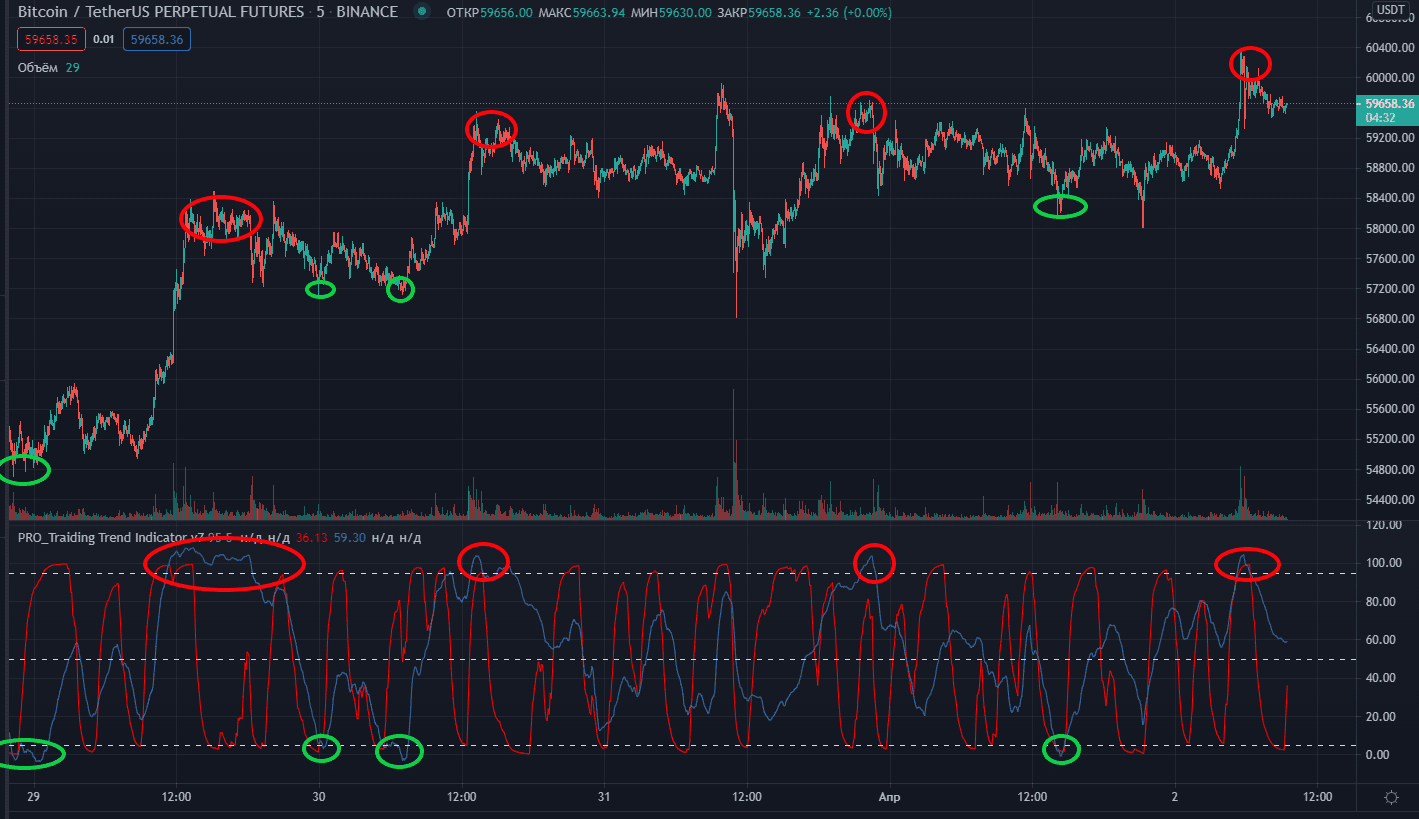
Filter Line
Filter Line can be used as an additional filter for searching for a trade entry.
NEW FILTER ROP (green and orange)
New filter ROP is two lines green and orange. They are paired with the ROP RSI (red) to determine the best trade entry.
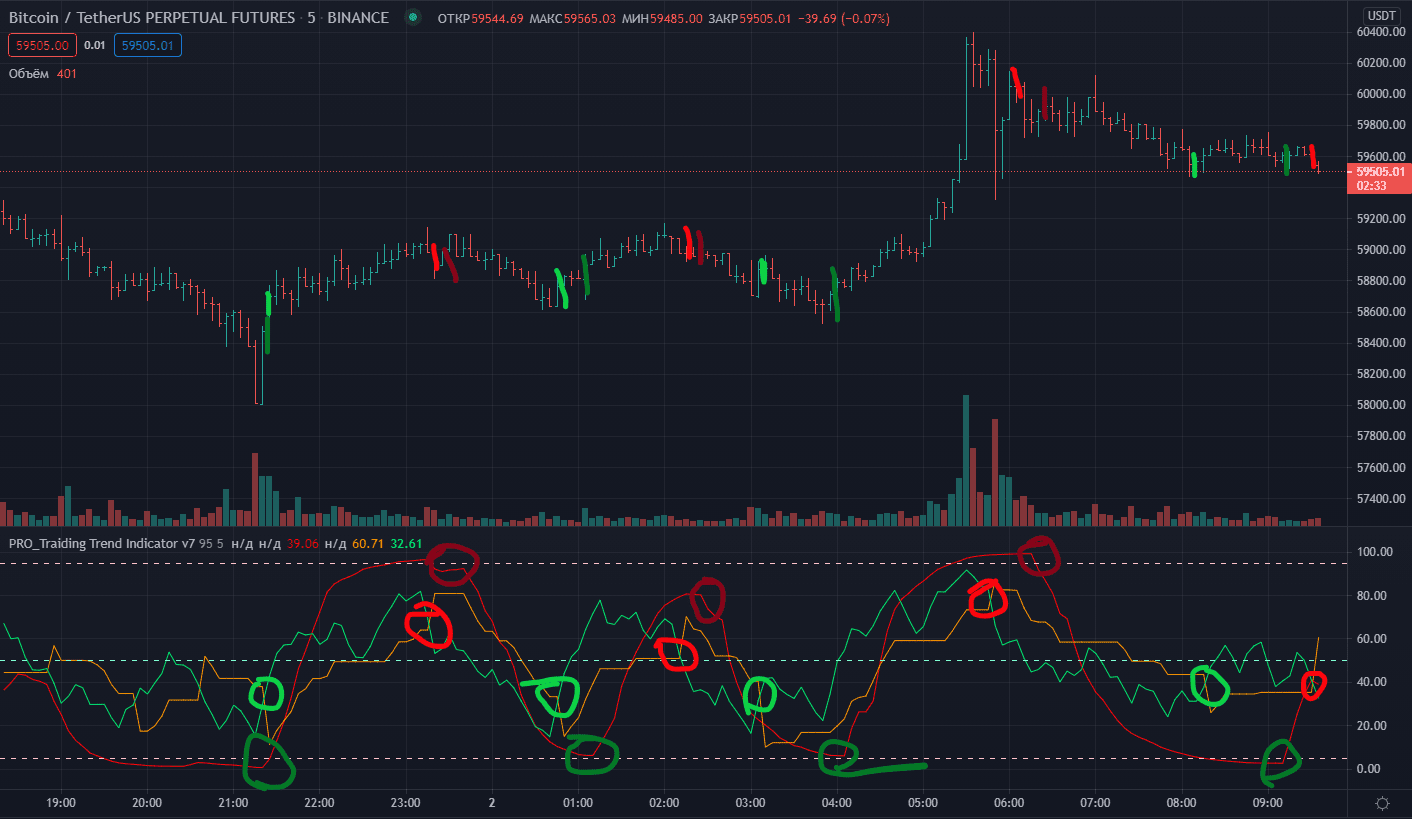
New filter ROP
New filter ROP — these are two lines, a green trend line and an orange control line.
When the green trendline crosses the control line upwards, this is the long entry point.
When the green trendline crosses the control line downward, this is the short entry point. As a rule, after such crossings, the red ROP RSI line, a little later, also begins to reverse.
Settings PRO_Traiding Trend Indicator
If you hover the mouse over the indicator name, you can see a gear, click on it.
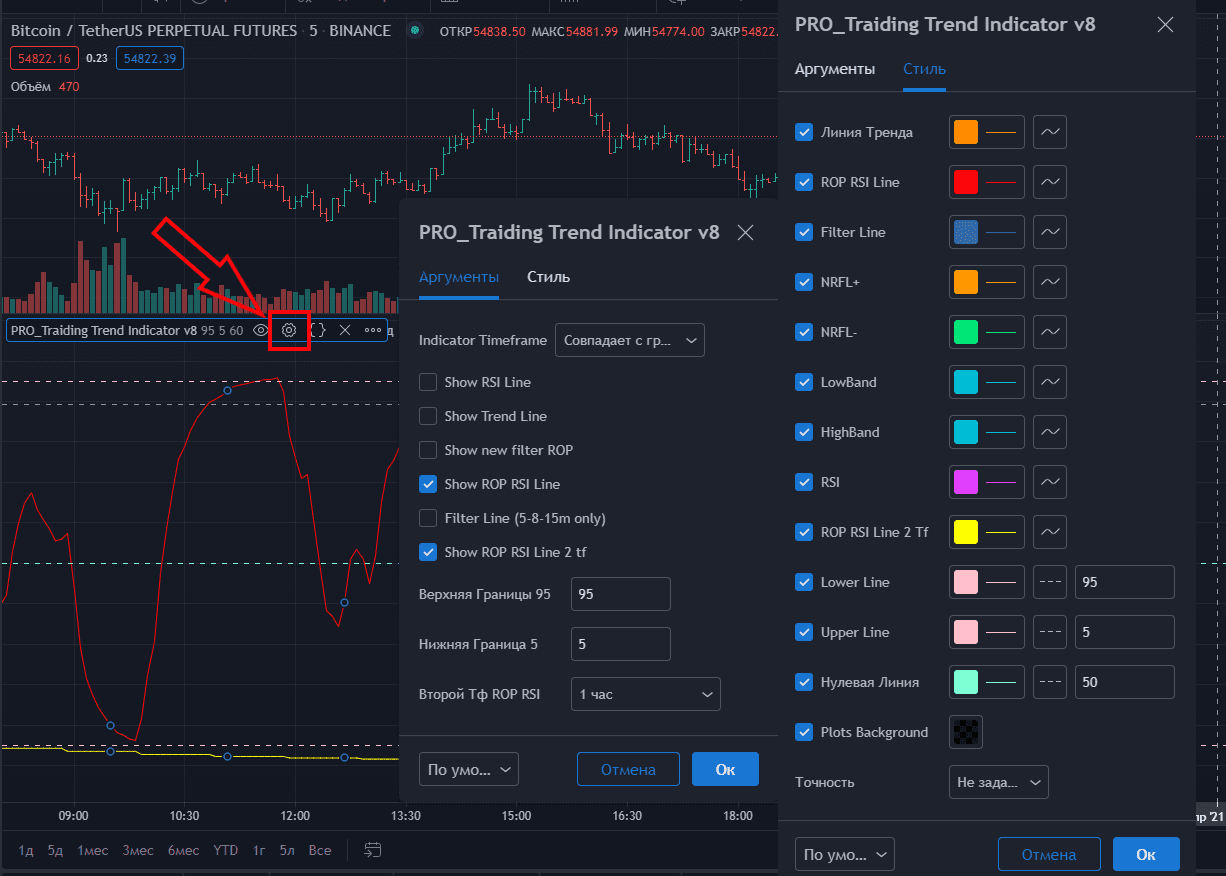
Settings indicator
In the arguments tab, the indicator settings allow you to enable and disable instruments. Change the indicator timeframe. Change the lower and upper boundaries of the intersection.
In the style tab, the indicator settings allow you to change the style of each line as you like.
Alerts
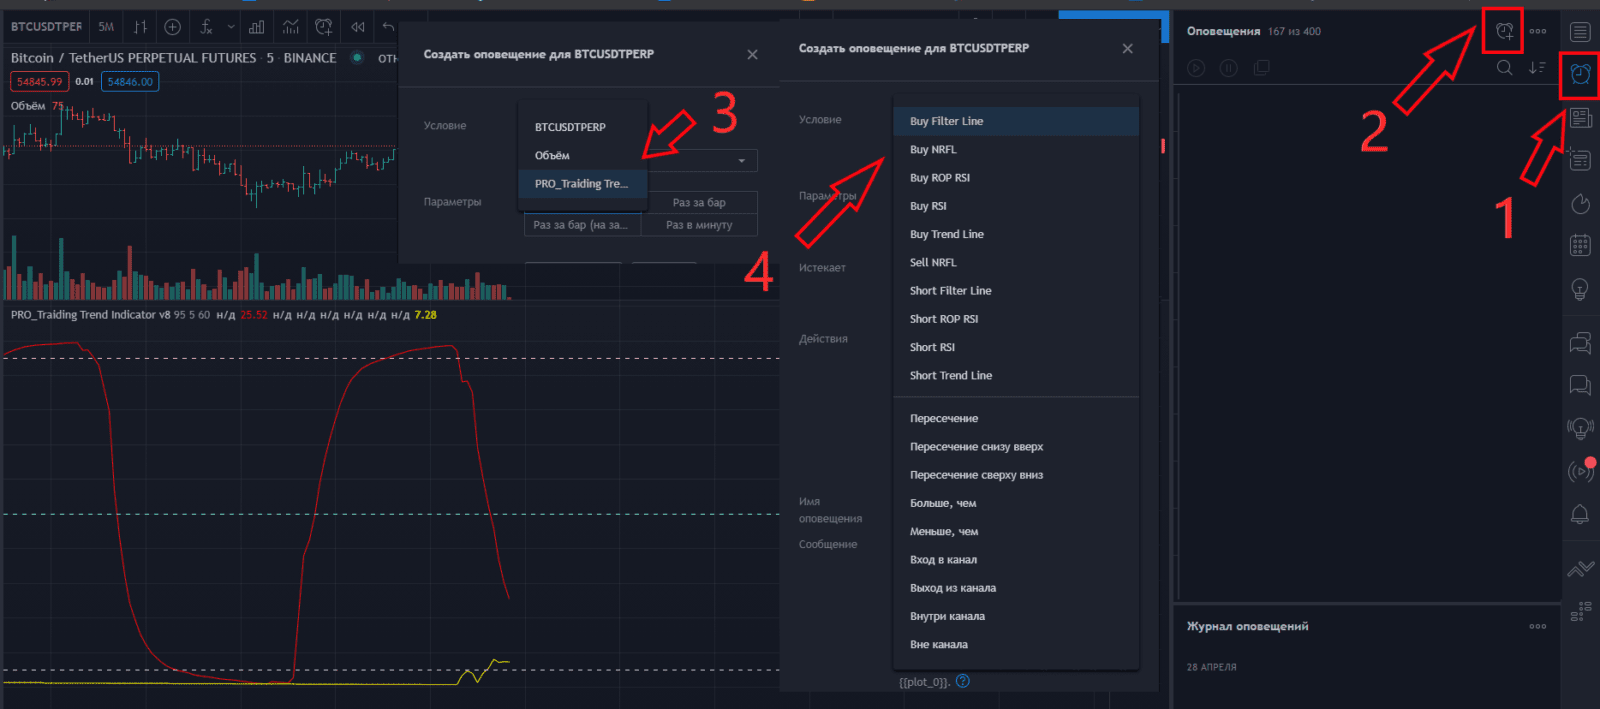
The tradingview platform has the ability to notify the trader about crossovers on the chart. We have made convenient templates for customized crossing notifications and built them into the indicator.
Crossing alerts
You need to open the tab for creating alerts, select our indicator from the list, select from the drop-down list on which line to place the alert.
For some lines, it is possible to indicate crossings on the chart. To do this, you need to use the Trend Indicator Lite 5-8-15m and Trend Indicator lite 1h.